Making Sense with Data – R, Tableau, MS Excel

This course was an introduction to R including the application of the software for statistical analysis. Statistical concepts such as data preparation, type I & II errors, hypothesis testing, sampling etc were studied with application-oriented learning activities. The course culminated with a final project presentation.

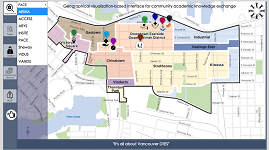
Master’s Thesis – Design of a geographical visualization-based interface for a community academic knowledge exchange – Axure RP9, Voyant, MS Excel

The aim of the research project was to develop a visual map-based interface to the Downtown Eastside Research Access Portal (DTES-RAP). DTES-based journal articles were studied to identify places, organizations and topics. A design-thinking approach was followed, with stages to learn about user needs, build a model, and test it. A small study was carried out with community members with the approval of the human ethics board, to evaluate the current design and identify areas for improvement.