The final project for this course was chosen as "Statistical analysis of Fatal Accident Data for the year 2015 covering the states of the USA." The data was obtained from the NHTSA (National Highway Traffic Safety Administration) of the USA. The final project presentation included slides as follows;
Making Sense with Data – R, Tableau, MS Excel

Data Analysis / Data visualization / MS Excel / MS PowerPoint / Oral presentation / R - Programming / Research
This course was an introduction to R including the application of the software for statistical analysis. Statistical concepts such as data preparation, type I & II errors, hypothesis testing, sampling etc were studied with application-oriented learning activities. The course culminated with a final project presentation.


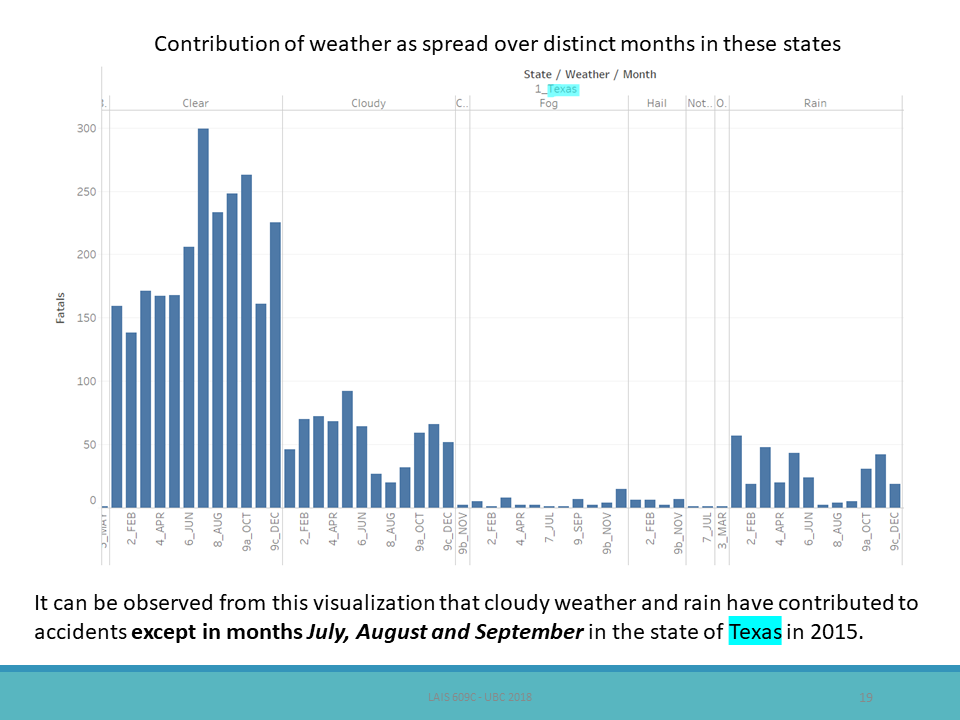
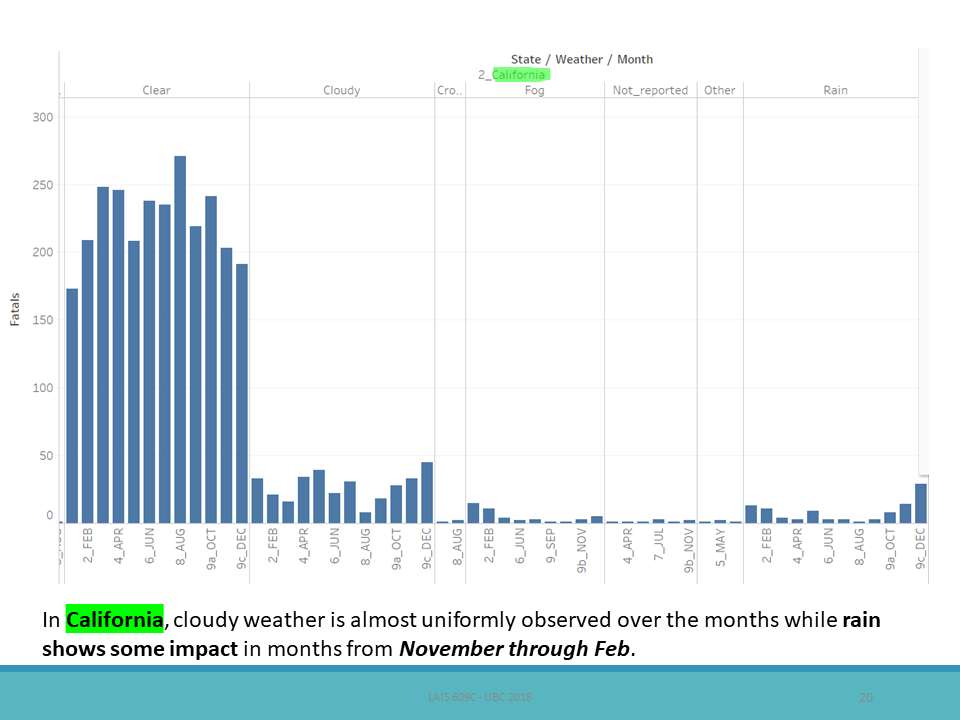
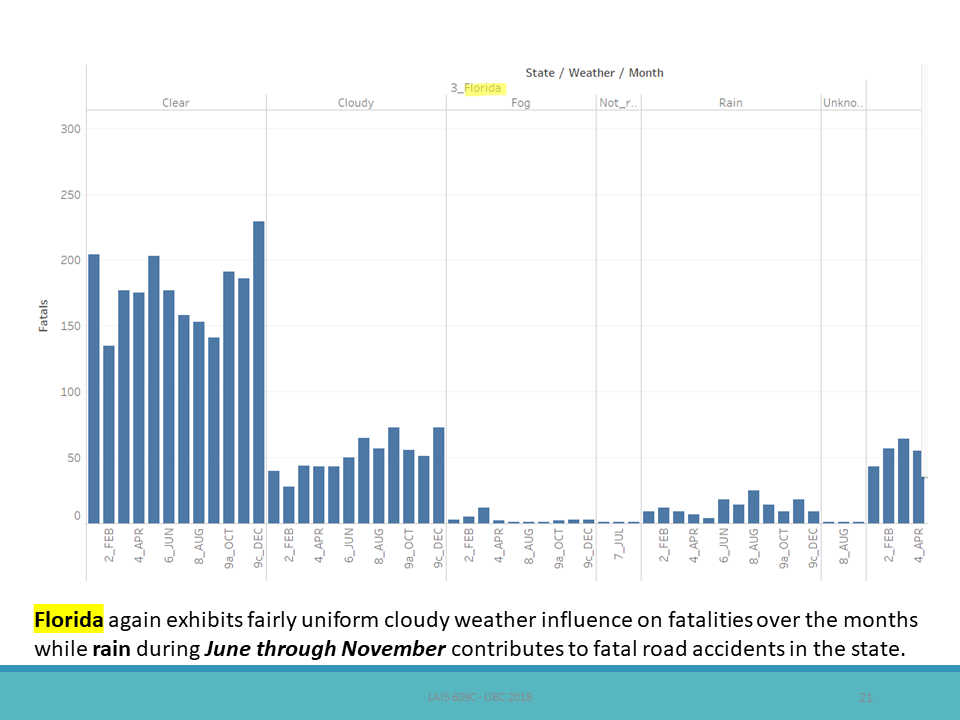
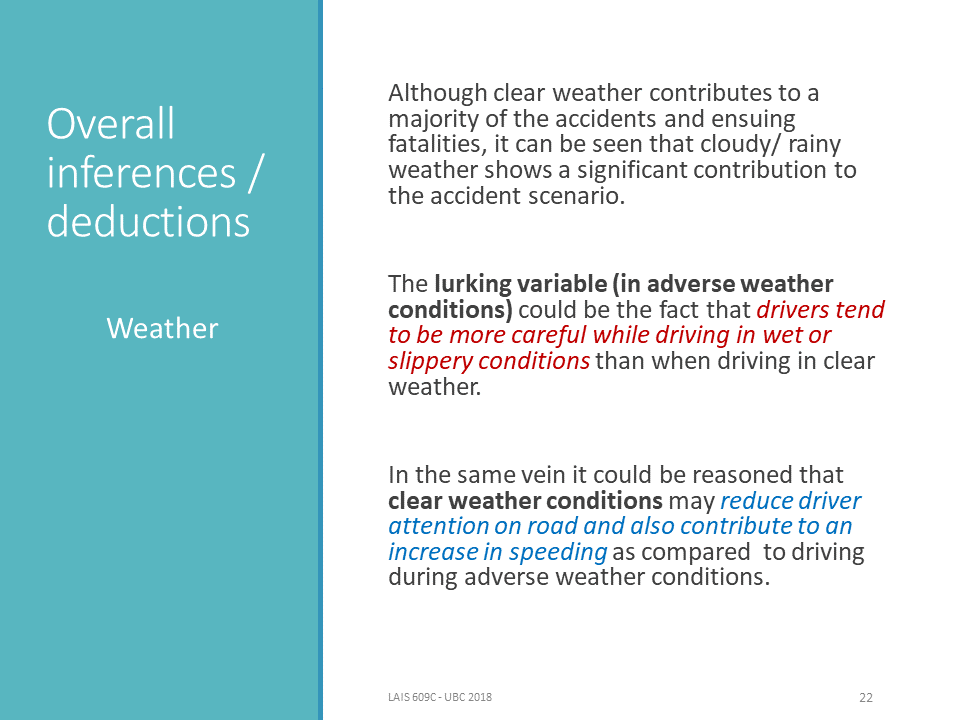
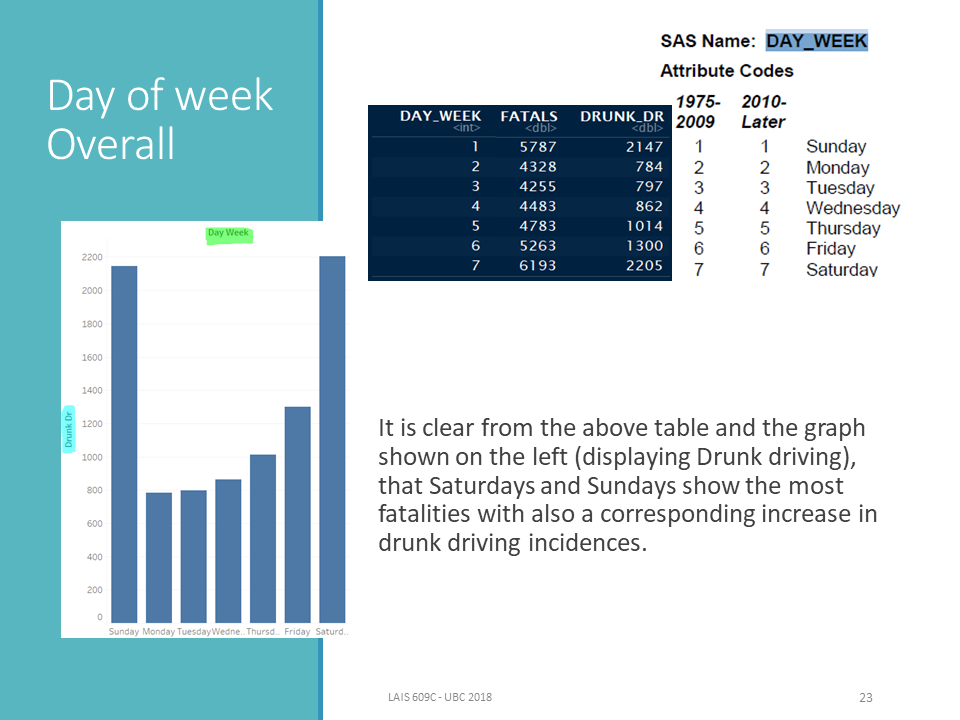
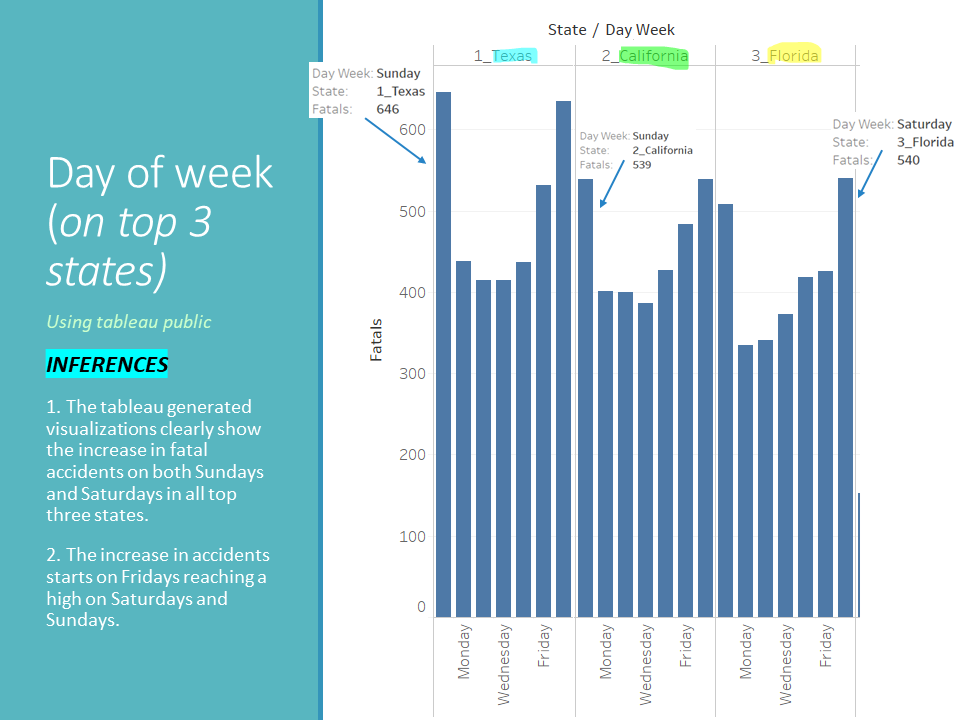
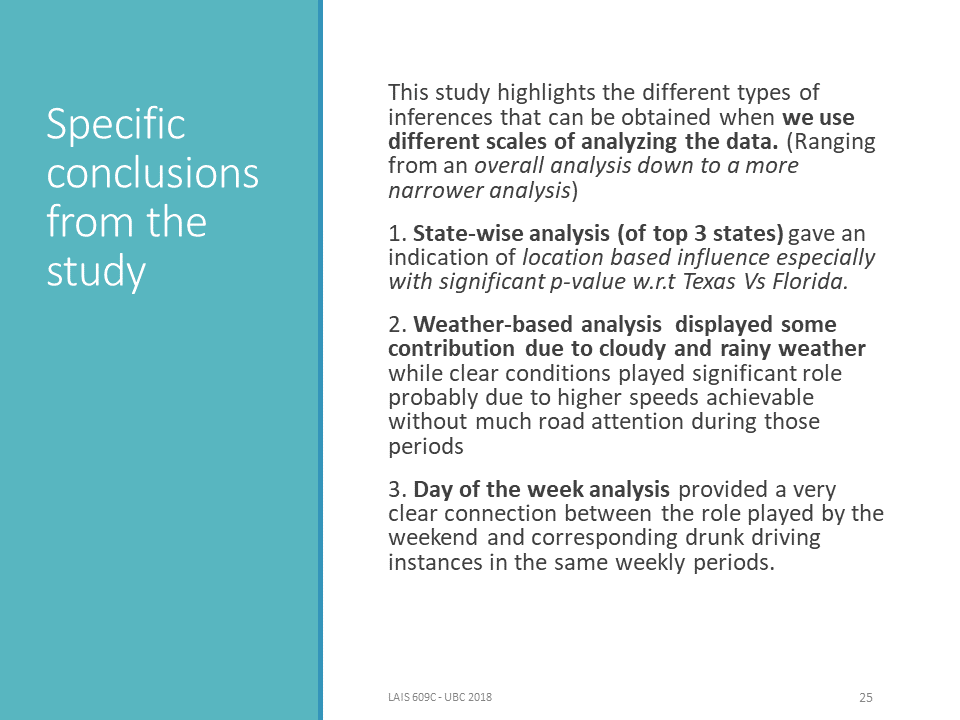
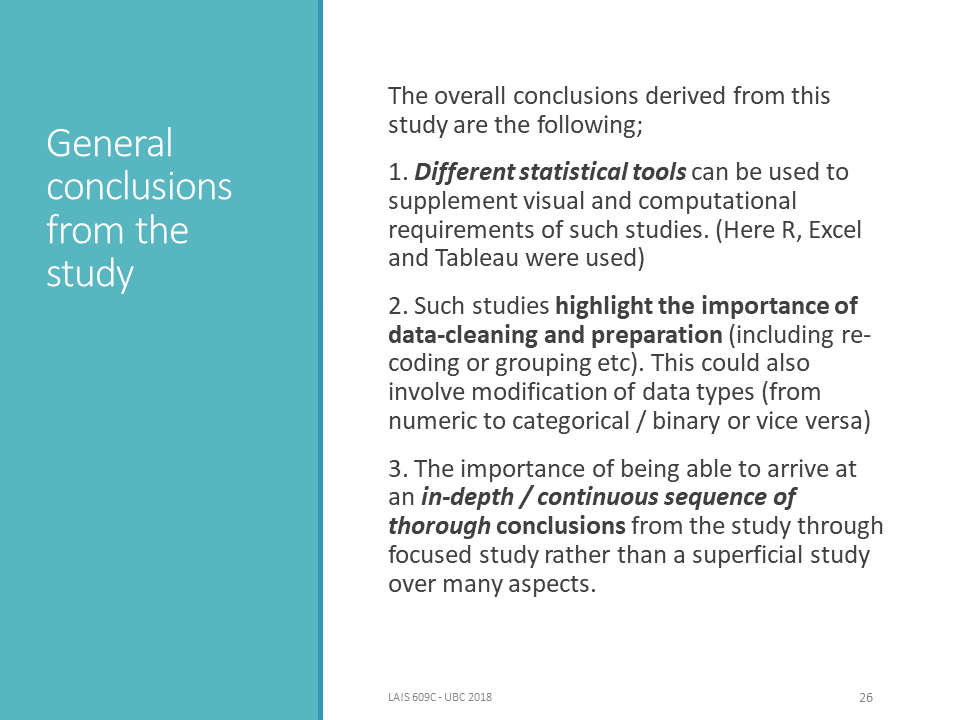


This course and the project activity taught me the importance of critical thinking for realistic statistical analysis. The project helped me to gain knowledge on data preparation and to adopt software such as R, MS Excel and Tableau for statistical analysis as well as data visualization.